Mapping by Industry
Why It Matters
A construction superintendent needs to know if a foundation is 2 inches off. A farmer wants to see which 20-acre section is stressed. A mining manager needs to know how many tons of gravel moved this month.
Same drone. Same camera. Completely different deliverables, workflows, and accuracy standards. Understanding what each industry actually needs from your data determines whether you get repeat business or a one-time gig.
Construction
Construction drone mapping breaks into four main workflows:
Pre-construction site surveys: Fly the raw site before groundbreaking. Deliver a topographic surface with 2-3 cm accuracy that engineers import directly into CAD for grading plans. A typical 10-acre site takes about 45 minutes of flight time and processes in 2-3 hours.
Progress tracking: Fly weekly or biweekly to generate orthomosaics that project managers overlay on the building plan. This creates a visual timeline showing exactly where work stands. Most contractors want these delivered as GeoTIFFs they can open in their existing GIS software.
Cut/fill calculations: Compare surfaces from different dates to calculate exactly how much dirt has been cut or filled. This lets earthworks crews verify they are meeting specs without waiting for a traditional survey crew. Expect $300-800 per cut/fill report depending on site size.
Deviation detection: Overlay the as-built point cloud against the original CAD design to check structural compliance. You are looking for deviations exceeding the project tolerance, typically 1-2 cm for critical elements. This catches problems early when corrections cost hundreds instead of thousands.
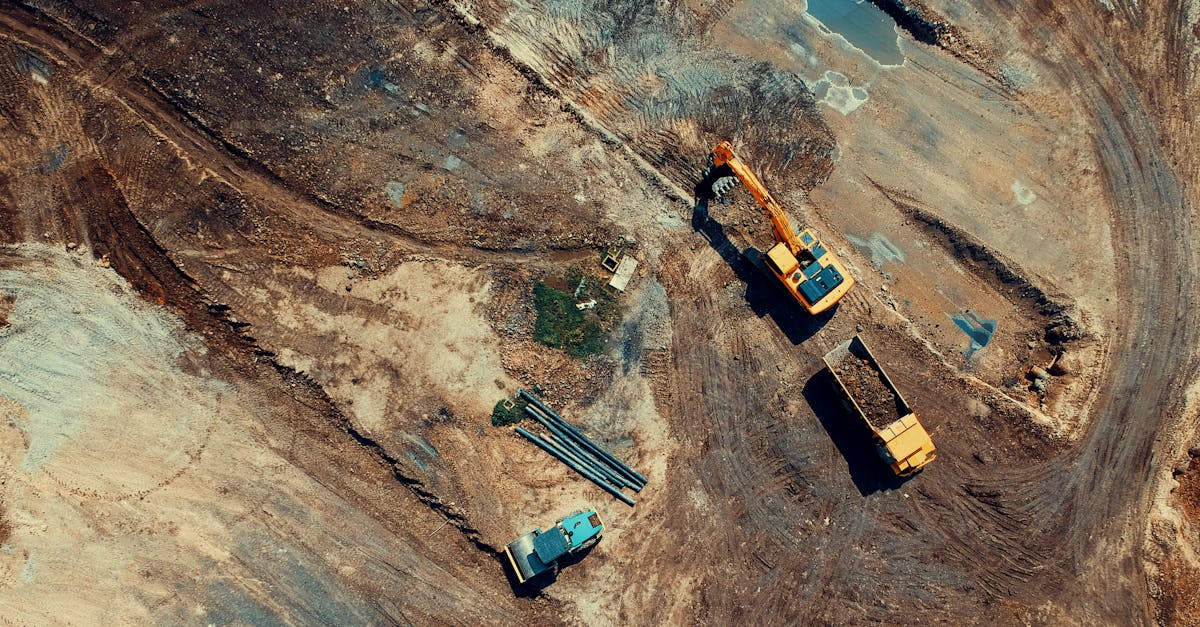
Mining and Aggregates
Mining operations run on volume numbers, and drone mapping delivers them faster and safer than ground-based methods.
Stockpile volume measurement: This is the single most common mining drone application. Fly stockpiles with 70% front overlap and 65% side overlap to generate dense point clouds. Volume calculations typically achieve 2-3% accuracy compared to ground-truth measurements. A medium quarry with 8-10 stockpiles takes about 90 minutes to fly and generates reports the same day.
Pit progression tracking: Monthly flights document how the pit expands over time. These records satisfy regulatory requirements and help planners optimize blast patterns and equipment positioning. Deliverables include elevation change maps showing exactly where material was removed.
High wall inspections: Replace the boot-on-the-ground safety walkthrough with a detailed orthomosaic that geologists can annotate from their desk. You are looking for crack propagation, loose material, and water seepage that could indicate instability.
Tailings dam monitoring: Fly tailings facilities quarterly to track settlement, check for seepage, and verify that dam crests are maintaining design elevation. Regulatory agencies increasingly require this documentation, creating steady contract work for drone operators.
Agriculture
Agricultural mapping serves a fundamentally different purpose than surveying. You are not measuring locations. You are measuring plant health.
Crop health mapping with NDVI: Multispectral sensors capture near-infrared data that healthy plants reflect strongly and stressed plants do not. NDVI values range from -1 to 1, with values above 0.6 indicating healthy vegetation and values below 0.3 signaling problems. Fly at 60-70 meters to get 3-5 cm per pixel resolution across a 40-hectare field in a single 20-minute battery.
Irrigation management: Thermal imagery reveals uneven watering patterns. Dry spots show as warmer areas, overwatered zones appear cooler. This data drives irrigation adjustments that typically save 15-25% on water costs for center-pivot operations.
Field boundary mapping: Create precise boundary polygons that eliminate overlaps in fertilizer application and simplify crop insurance documentation. Accuracy requirements here are lower, 10-15 cm is usually sufficient.
Precision application maps: Export shapefiles showing problem zones that variable-rate equipment uses to adjust fertilizer, pesticide, or seeding rates. This is where your mapping data directly translates to input cost savings for the grower.
Yield prediction: Combine early-season NDVI data with historical yield records to forecast production. This helps farmers make marketing decisions months before harvest.
Environmental Monitoring
Environmental mapping often requires higher accuracy than people expect, because regulatory compliance depends on defensible data.
Wetland delineation: Generate detailed terrain models showing hydrology patterns, vegetation boundaries, and elevation thresholds that determine wetland classification. Accuracy of 2-3 cm vertical is standard because jurisdictional boundaries can hinge on elevation differences of 15 cm or less.
Erosion tracking: Fly the same stretch of riverbank or coastline quarterly. Compare surfaces to quantify exactly how much material has eroded. This data supports permitting, restoration funding requests, and legal proceedings.
Coastal change detection: Document beach profiles before and after storm events. Track long-term shoreline migration to inform habitat protection and development setbacks.
Reforestation verification: Count planted seedlings, assess survival rates, and map planting density across large areas that are impractical to survey on foot. A 200-hectare plantation takes about 3 hours to fly and processes overnight.
Wildlife habitat mapping: Classify vegetation types, map water sources, and identify corridors that wildlife use for movement. Conservation organizations use this data to prioritize land acquisition and design wildlife crossings.
Real Estate and Land Development
Topographic surveys for planning: Developers need 5-10 cm accuracy surfaces to determine buildable areas, calculate grading costs, and identify constraints like wetlands or steep slopes. A 20-acre residential development site typically commands $1,500-3,000 for a full topographic package.
Boundary verification: Map fence lines, road edges, and existing structures relative to recorded property boundaries. This catches encroachments before they become legal problems during closing.
Subdivision design support: Provide the base mapping that civil engineers use to lay out roads, lots, and utility corridors. Faster mapping means faster design starts, which developers value directly.
Marketing visuals: Export high-resolution orthomosaics and 3D models for brochures, websites, and virtual tours. This work pays less than survey-grade mapping but requires less processing rigor and turns around quickly.
Quick Check
Q: What overlap settings do you need for stockpile volume calculations? A: 70% front overlap and 65% side overlap. This generates the dense point cloud needed for accurate volume measurements, especially on the steep slopes typical of aggregate stockpiles.
Q: Why does wetland delineation need higher accuracy than agricultural field mapping? A: Regulatory boundaries often depend on elevation thresholds as small as 15 cm. Your data needs to be accurate enough to defensibly show whether ground meets that criterion, which means 2-3 cm vertical accuracy.
Q: What is the difference between construction progress tracking and deviation detection? A: Progress tracking uses orthomosaics to show where work stands visually, useful for project management. Deviation detection compares as-built point clouds against design CAD models to measure structural compliance numerically.
What’s Next?
Now that you know what different industries need from your mapping data, we need to talk about whether your data actually meets their requirements. Next up: accuracy standards, quality control checks, and how to verify your deliverables before you send them.
Want to specialize in construction drone mapping? Pilot Institute covers industry-specific workflows in their professional courses.