How to Read Sectional Charts: Complete Visual Guide for Drone Pilots
Sectional charts look like a wall of chaos until you know the system. Here's every symbol and marking that matters for your Part 107 exam and real flights.
If you’ve ever opened a sectional chart and felt like you were staring at a map designed by someone who actively hated you, welcome to the club. The colors, symbols, random numbers scattered everywhere — it’s a lot. But sectional charts follow a logical system once you break it down. And if you’re flying drones under Part 107, you need to understand these charts for both the knowledge test and your actual flights.
Let’s walk through exactly what you’re looking at.
What Sectional Charts Actually Are
Sectional charts are aviation maps published by the FAA. They’re drawn at a 1:500,000 scale — one inch on the chart equals about eight miles in the real world. Each chart covers a specific region and is named after a major city: Los Angeles, Seattle, Houston. When someone says “check the LA sectional,” that’s what they mean.
These charts get updated every 56 days because airspace and navigation info change constantly. Always use a current version.
The Grid System: Latitude and Longitude
Look at the edges of any sectional and you’ll see numbers running along the borders — latitude (north-south) and longitude (east-west) coordinates, measured in degrees, minutes, and seconds.
Each full degree is split into 60 minutes. On a sectional, tick marks appear every minute, with the 5th and 10th marks slightly taller. Each grid box spans 30 minutes (half a degree). This grid is how you pinpoint exact locations, and the Part 107 exam will make you find coordinates on a chart.
Reading the Ground: Terrain and Elevation
Before you fly, you need to know what’s below you. Sectionals show terrain two ways.
Colors. Green means relatively low terrain. As elevation increases, the green fades into lighter tints, then shifts to brown for higher ground. A quick scan tells you flat farmland vs. mountain ridges.
Contour lines. Those squiggly brown lines represent changes in elevation at 500-foot intervals. Lines packed tight together mean steep terrain. Spread out means gradual slopes.
MEF (Maximum Elevation Figure). Those big numbers printed in each grid quadrant (like “77” or “12”) represent the highest possible obstacle or terrain in that quadrant, in hundreds of feet MSL, rounded up. If the MEF shows 77, something in that quadrant reaches 7,700 feet MSL. Plan accordingly.
Airspace: Where You Can and Can’t Fly
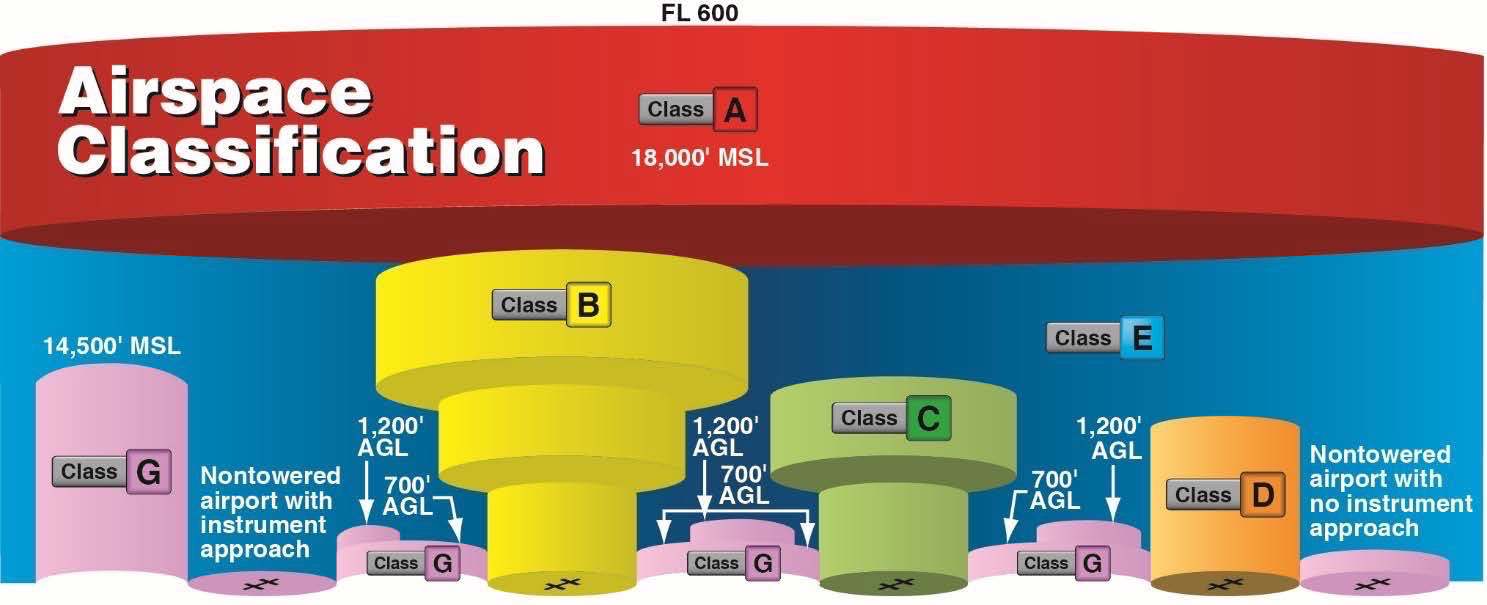
This is the big one for drone pilots. Airspace classes use specific colors and border styles.
Class B — solid blue lines, shaped like an upside-down wedding cake with layers stacked on each other, getting wider as they go down. Surrounds the busiest airports. You cannot fly here without specific FAA authorization.
Class C — solid magenta lines. These circle mid-sized airports with control towers and radar approach control. Layered airspace. Authorization required.
Class D — dashed blue lines around airports with control towers but no radar approach. Ceiling typically 2,500 feet AGL. Authorization required.
Class E — shows up as faded magenta shading or dashed magenta lines where it starts at the surface. Class E also exists at 700 feet AGL or 1,200 feet AGL without any visual boundary. For drone pilots, Class E below 400 feet requires authorization.
Class G — uncontrolled airspace. It’s not marked. Class G is everywhere that isn’t designated as something else. This is where most drone pilots fly without needing authorization.
That Fraction Notation
You’ll see fraction-like numbers near airspace boundaries: “100/SFC” or “71/100.” The top number is the floor (where the airspace starts), the bottom is the ceiling (where it ends). SFC means surface.
The FAA drops the thousands digit to save space. So “71/100” means floor at 7,100 feet MSL and ceiling at 10,000 feet MSL. Confusing at first, but you get used to it.
Airport Symbols
Airports show up as circles with runways drawn inside. Blue circles mean towered airports. Magenta circles mean non-towered airports. You’ll see the airport name and identifier code (like LAX or 1CA9 for a private strip).
Obstructions
Little triangle shapes scattered across the chart represent obstacles. A solid triangle is a substantial obstruction like a tower. An inverted triangle with a dot on top is a guyed mast.
Next to each, two numbers: the top is height MSL, the bottom (in parentheses) is height AGL. “1545 (500)” means 1,545 feet MSL, which is 500 feet above the ground beneath it.
VOR Stations
VORs (VHF Omnidirectional Range) are navigation beacons showing up as compass rose symbols with frequency and three-letter identifier. Drone pilots don’t use VORs for navigation, but they’re useful landmarks and they appear on the test.
Special Use Airspace
Restricted areas — blue hatched boundaries. Hazards like artillery firing or missile tests. Check before flying through.
MOAs (Military Operations Areas) — magenta hatched areas with names. Military training happens here. Drones aren’t legally banned, but sharing airspace with fighter jets is a terrible idea.
Prohibited areas — the serious ones. Blue hatched with “P” prefix (like P-56 around Washington DC). Nobody flies here without explicit permission.
Military Training Routes
MTRs are corridors where military aircraft fly low and fast. Marked with “VR” (visual rules) or “IR” (instrument rules) followed by a number. These aircraft move fast — check if any MTRs cross your planned flight area.
Isogonic Lines
Those purple dashed lines with labels like “10E” or “5W” show the difference between true north and magnetic north. Your compass points to magnetic north, the map to true north. Drone pilots rarely worry about this, but it’s on the exam.
The Chart Supplement
The sectional gives you the big picture. For detailed airport info (runway lengths, frequencies, operating hours), consult the Chart Supplement (formerly Airport/Facility Directory). Available free online from the FAA.
SkyVector: Free Digital Sectionals
You don’t have to buy paper charts. SkyVector.com gives you free access to current sectionals with zoom, pan, and search. The FAA also offers charts directly, but SkyVector is faster and easier.

Put It Together
Reading sectional charts is a skill that comes with practice. Pick your local area and identify every symbol, airspace boundary, and obstruction you can find. Cross-reference with SkyVector and the Chart Supplement. After a few hours, the chaos starts making sense.
Our free Part 107 Course has dedicated lessons on charts, airspace, and coordinates with practice questions.